What is analysis ready data?
Analysis ready data is data that has been assembled, pre-processed, and well documented; it is ready to work with immediately. The Caslys Analysis Ready Data (CARD) Stack product is a collection of analysis ready datasets prepared for your unique project.
Every GIS project begins with assembling data, a complicated task that can sometimes consume more budget and time than anticipated. Our CARD Stack product streamlines this effort by providing your team with a comprehensive set of pre-processed and documented source data, so analysis and visualization can start right away.
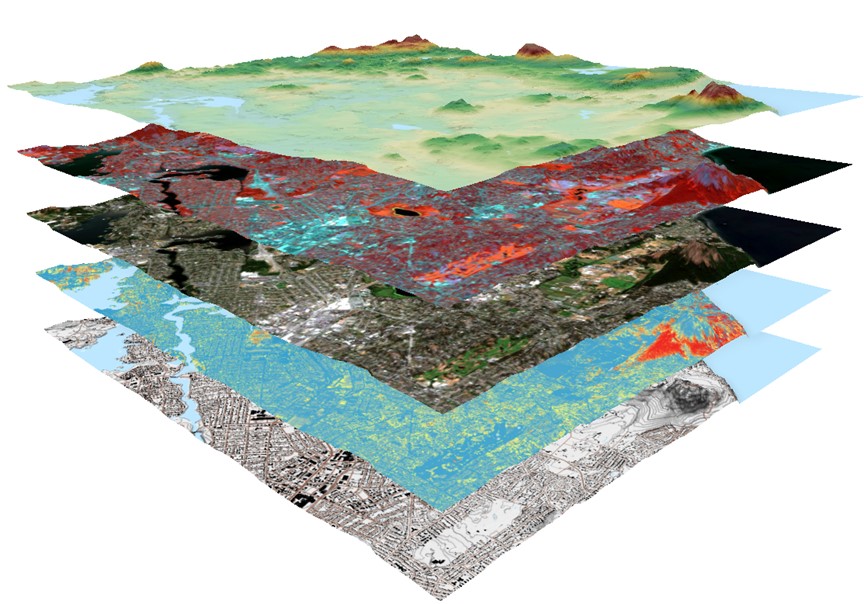
With access to millions of satellite images, we can assemble the best data to support your project initiatives. Our custom tools compile a suite of datasets into a single convenient data package. This package includes imagery and terrain data in raster formats that are projected and stacked for analysis. In addition to source data, we include several data layers derived from those inputs. We can also compile a series of vector datasets to support your project, as desired.
Top three benefits of using our analysis ready data
-
All the necessary pre-processing procedures are complete and the data is ready for analysis.
-
All processing steps are completed in a consistent manner, so you can have greater confidence in the data being used to inform your decisions.
-
CARD Stack brings temporal intelligence to your analysis. We take advantage of the rich archive of continuously growing Earth observation data to conduct various multitemporal analyses, the results of which can be used to better understand our changing environment and meet your project objectives.