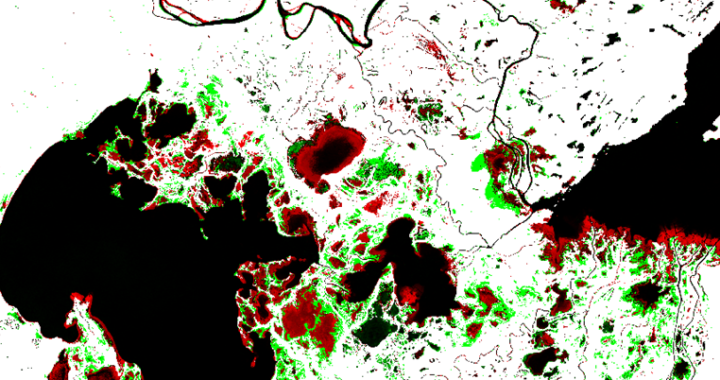
Our remote sensing team at Caslys highlights surface water detection methods in a case study of Northern Alberta and the Peace-Athabasca region. This delta and its dynamic hydrologic environment is a strong example of an area that experiences a high degree of change in surface water levels annually. Check out the article below to see our results and learn more about surface water detection! What is surface water? Surface water refers to any body of water found on the Earth’s surface, encompassing both saltwater and freshwater sources. Freshwater surface bodies such as rivers, streams, and lakes are essential for maintaining ecosystems by providing habitats for diverse plant and animal species. Additionally, they support numerous human activities, including drinking water supply, irrigation, wastewater treatment, livestock management, industrial processes, hydro power generation, and recreational activities. The presence of surface water varies in response to a variety of driving forces including, but not limited to: human activity, environmental change, and climate. Forest fires, floods, rising temperatures, urban and industrial development, as well as other climate factors and human activities all can impact surface water presence. Due to its volatile nature, available hydrologic spatial datasets often overlook seasonal surface water changes. The gap in up-to-date hydrologic data can be filled with raster-based time series approaches that allow us to view hydrology in a more dynamic way. The resulting surface water layers are important for effective planning and decision making in multi-use landscapes. Case Study: The Peace-Athabasca Delta Northern Alberta is home to one of the world’s largest inland freshwater deltas. The area serves as a refuge for more than one million migratory birds each year, as habitat for 270 animal species; including the globe’s largest free-roaming herd of wood bison, as an enclave for native grasses and sedge’s and as the lifeblood for the […]
Continue readingTag Archives: Dataset
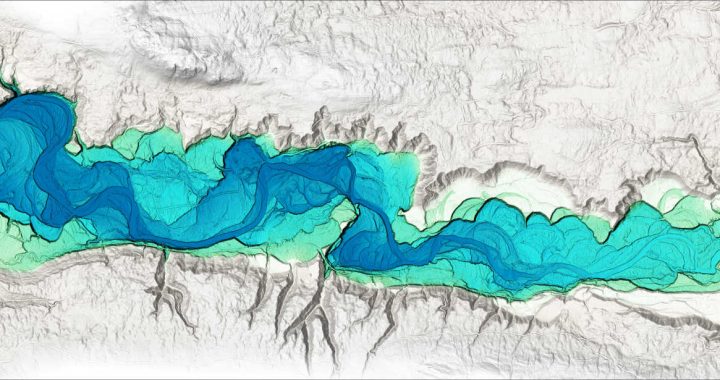
Floodplain Visualization with Relative Earth Models
In this article, we explore how Relative Earth Models (REMs) can be used to visualize floodplains. Fluvial environments have significant natural and anthropogenic roles. Rivers are key features that shape our natural environment and create important ecological habitats. Additionally, they have numerous uses, including those relating to transportation, hydroelectricity, and recreational activities. While many reasons may attract us to them, these dynamic environments can also repel us with flood events and the dramatic hydrodynamic forces that shape rivers – the recent landslide event in the Chilcotin River (located in the Cariboo Regional District, British Columbia) being an example of such forces at play. This duality makes fluvial environments an important subject of study. The Role of Topography in River Systems Topographic data is often represented by a Digital Elevation Model (DEM), where an elevation value is assigned to each pixel in an image. These values can represent the ground or bare earth as in the case of a Digital Terrain Model (DTM). Due to river systems flowing downhill, a decreasing trend will be present in the elevation values of the DTM. Within these trending elevation values, there are smaller topographic features that make up the river corridor. These features play a significant role in the river’s hydraulics and will influence the way in which sediment is eroded or deposited. Floodplain Visualization with Relative Earth Models A technique used to better understand these topographic variations is a Relative Earth Model (REM) or Height Above River (HAR) raster. An REM is created by removing the downward slope of the river, and leaving only the local topographic features so that the resulting elevation values are relative to the height of the river. REMs are primarily used as a tool to visualize river corridors, and can be used to identify historic river features as […]
Continue reading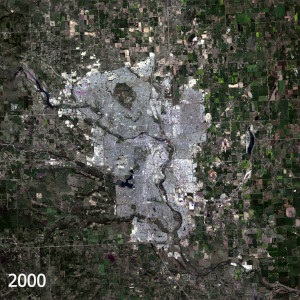
Calgary is Growing – Caslys Monitors Landscape Change
Calgary, Alberta is once again one of the fastest growing cities in Canada. With a constantly evolving city skyline, and growing community boundaries, our team at Caslys thought it would be interesting to apply our landscape change tools to see what’s been happening. We utilized Landsat satellite imagery and our new Caslys Analysis Ready Data (CARD) Stack processes, to explore the change in landscape across Calgary over the past 20+ years. The results are included in the article below, highlighting the overall expansion that the city is experiencing. With a strong job market and diverse amenities, Calgary is an attractive place to be and is recently one of the fastest growing metropolitan areas in Canada. Between 2022 and 2023, Calgary experienced the largest population increase in the country, surpassing 1.6 million people. We applied a few analysis methods to see what the growth distribution looks like on the landscape. There have been some significant growth spurts over the last couple decades. While suburban growth into the agricultural outskirts remains a common theme as you can see in the animation below, there are also new communal green spaces within the city. Development Milestones In 2013, Calgary moved forward with highway construction in two areas, developing the “Ring Road”. It’s part of a larger east-west/north-south trade corridor, and enhances the city’s accessibility. Improved transportation infrastructure helps connect the four quadrants of the city and links the new communities that are developing on the outskirts of Calgary. A projected 17 new neighbourhoods surrounding the city within the 2024 Area Structure Plans and Citywide Growth Strategy were announced. Within the downtown area of Calgary, further transportation development continues to push forward with additional light rail transit lines (LRT) being added to help commuters throughout the city. Olympic Plaza and the Eau Claire Market area […]
Continue reading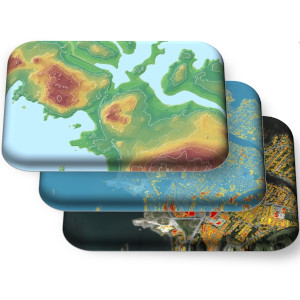
Caslys Releases New Geospatial Service
After years of technical development and internal pilot testing, Caslys Consulting is proud to officially announce our new geospatial service to the remote sensing and GIS world, the Caslys Analysis Ready Data (CARD) Stack! Assembling terrain data, spatial data, or satellite imagery at the beginning of a project is often a complicated and cost inefficient process. There is a large amount of geoprocessing needed to obtain high-quality data, satellite imagery, and build a suite of useful derivative map layers that meet project requirements. This can be a very time-consuming task, using up more project budget than necessary. What is CARD Stack? CARD Stack is a technical resource focused on allowing our customers the ability to easily generate comprehensive spatial datasets. These datasets kick-start both spatial and spectral analyses while also enhancing the visualization of a project site through a simple request submission. Caslys Consulting has created multiple scripts, tools, and geospatial resources with the goal of making this task easier for our customers. CARD Stack services efficiently streamline data package assembly and delivery for a client in a timely manner. Based on the request, a wide range of raster and vector products are consolidated by our team into a single, user-friendly data package. These packages can include: Learn more about CARD Stack today! The Caslys CARD Stack team is excited to help our customers accomplish their geospatial tasks in a fast and efficient manner. For pricing inquiries, product details, and more info on how CARD Stack can help fulfill your project needs, click here or follow the link below. CARD Stack website: https://www.caslys.ca/cardstack/ About Caslys For over 20 years, Caslys Consulting Ltd. has taken pride in offering a wide range of high-quality geospatial services for both environmental and natural resource management industries. Our focus is on interpreting and analyzing data […]
Continue reading