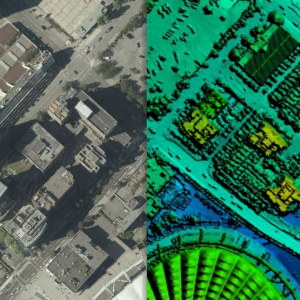
Over the past several years, the Province of British Columbia has made significant investments in LiDAR and has now released provincial LiDAR collections known as LidarBC under the Open Government License. This data is now freely available for anyone to download and use via the LidarBC Open Data Portal. Until recently, British Columbia was without publicly available LiDAR data. This limited access, combined with large file sizes, greatly limited the potential of many in the GIS world to conduct research using this rich data source. The LidarBC program has taken the LiDAR point cloud data from large areas and divided them into smaller, more manageable blocks of data, resulting in file sizes that will not overload browsers. To that end, the Portal uses a provincial map divided by tiles that allows users to locate the data they want precisely, without obtaining necessary excess data. This new tool, developed by Caslys Consulting, also contains a user-friendly interactive guide that shares valuable information on the step-by-step processes needed to use LidarBC’s Open LiDAR Data Portal. What is LiDAR? LiDAR (Light Detection And Ranging) is a uniquely accurate method for elevation acquisition, acting as an active remote sensing system that produces its own energy for acquisition of information. These LiDAR systems are made up of a laser, scanner and GNSS (GPS) receiver that are mounted onto an aircraft. The systems transmit short, high-frequency wavelengths of light to a surface, then record the time of flight and intensity of the back scatter returned to the sensor that make up a point cloud data set. The high spatial resolution of the resulting surface models allows the differentiation of many fine terrain features in both urban and natural environments. The Province of British Columbia now has this powerful active remote sensing system of LiDAR point cloud and derivative data […]
Continue readingCategory Archives: News
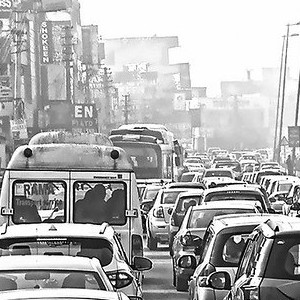
COVID-19 Isolation and Air Quality in Canada
There was a fair bit of press given to the impact that COVID-19 isolation or lockdown had on air quality in China and northern Italy – two places hard hit by this pandemic and also two places with particularly poor air quality due to industry, transportation and to some extent geography. As our Caslys team began working remotely from home, we wondered how air quality was being impacted here in Canada. So, we leveraged our earth observation skills and tools that we typically use to monitor the Earth’s surface and ventured into the atmosphere. We downloaded data from the Sentinel-5P Troposheric Monitoring Instrument to replicate what we saw in the news overseas. The focus was on nitrogen dioxide (NO2) that comes in large part from the combustion in our cars or the burning of fossil fuels for energy or industry. The Sentinel-5P satellite is able to map a variety of other parameters (listed in the website screen capture above), which may have applications for all sorts of air quality monitoring, but we focused solely on nitrogen dioxide to satisfy our curiosity. To avoid some of the seasonal variation, we plotted the average NO2 concentrations for the period when our local isolation began and the same seasonal range from one year earlier (March 2019 compared to March 2020). We also checked May 2020 to see if the lockdown is still influencing air quality. We looked into a couple of hotspots near Prince Albert, Saskatchewan and found that forest fires were the cause of lower air quality. We plotted the results over the National Geographic basemap service to see the hotspots and the generally improved air quality during isolation. In the images above, the highest concentrations of NO2 in the atmosphere are shown in purple – fading to orange and yellow. The […]
Continue reading