There was a fair bit of press given to the impact that COVID-19 isolation or lockdown had on air quality in China and northern Italy – two places hard hit by this pandemic and also two places with particularly poor air quality due to industry, transportation and to some extent geography. As our Caslys team began working remotely from home, we wondered how air quality was being impacted here in Canada. So, we leveraged our earth observation skills and tools that we typically use to monitor the Earth’s surface and ventured into the atmosphere. We downloaded data from the Sentinel-5P Troposheric Monitoring Instrument to replicate what we saw in the news overseas.
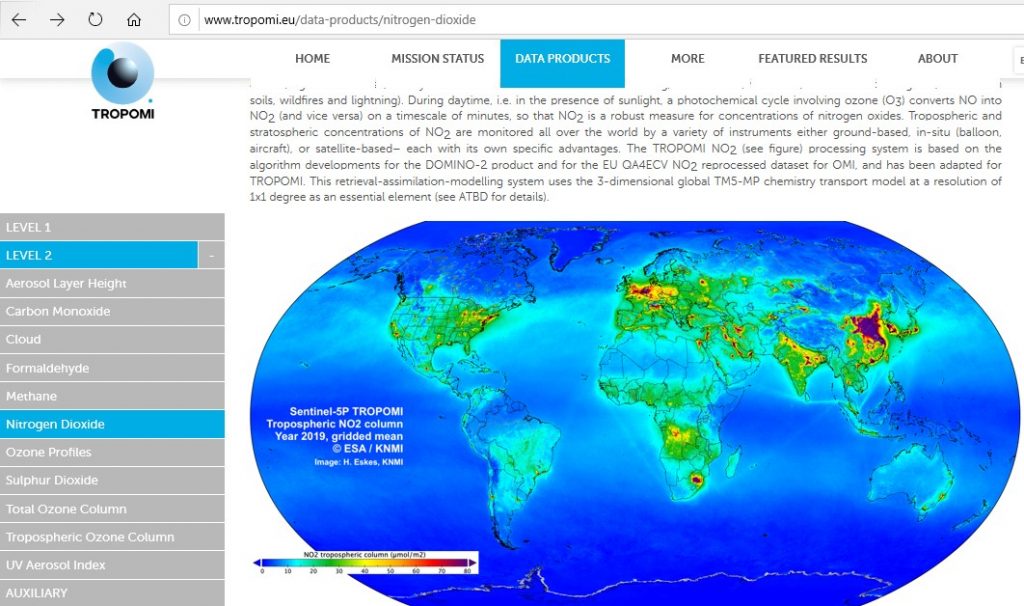
Screen capture of the Sentinel-5P Troposheric Monitoring Instrument website.
The focus was on nitrogen dioxide (NO2) that comes in large part from the combustion in our cars or the burning of fossil fuels for energy or industry. The Sentinel-5P satellite is able to map a variety of other parameters (listed in the website screen capture above), which may have applications for all sorts of air quality monitoring, but we focused solely on nitrogen dioxide to satisfy our curiosity. To avoid some of the seasonal variation, we plotted the average NO2 concentrations for the period when our local isolation began and the same seasonal range from one year earlier (March 2019 compared to March 2020). We also checked May 2020 to see if the lockdown is still influencing air quality. We looked into a couple of hotspots near Prince Albert, Saskatchewan and found that forest fires were the cause of lower air quality. We plotted the results over the National Geographic basemap service to see the hotspots and the generally improved air quality during isolation.
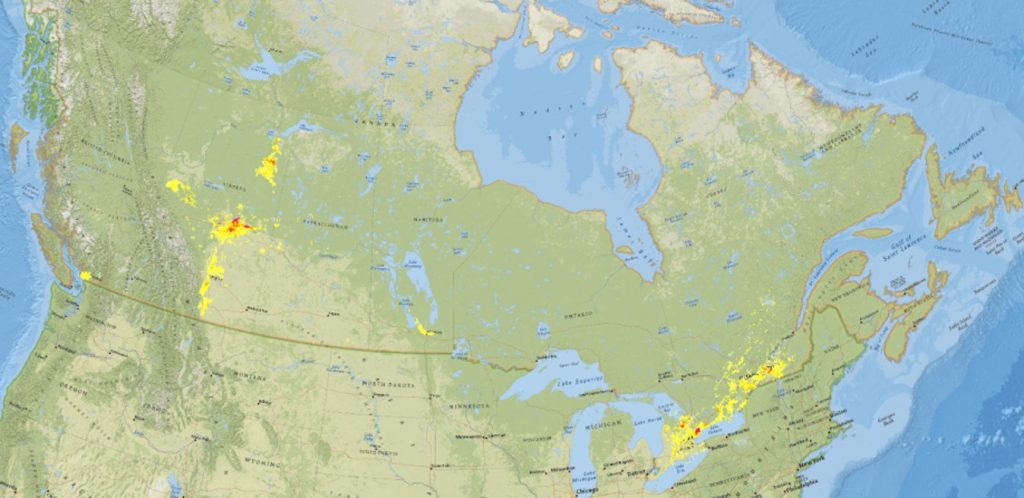
Nitrogen dioxide concentrations, March 2019.
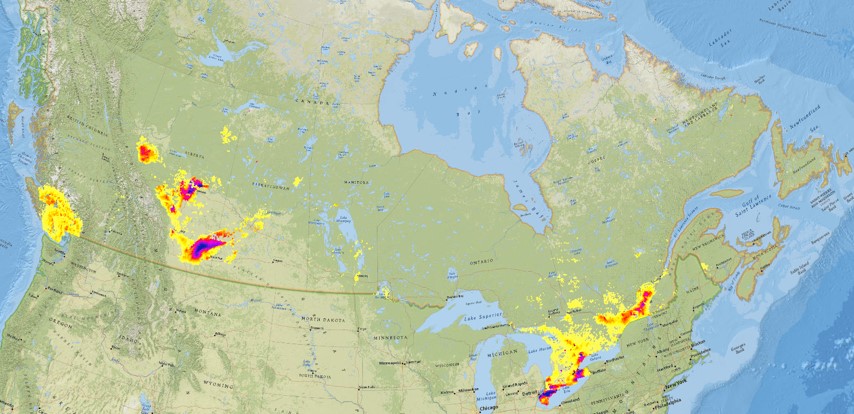
Nitrogen dioxide concentrations, March 2020.

Nitrogen dioxide concentrations, May 2020.
In the images above, the highest concentrations of NO2 in the atmosphere are shown in purple – fading to orange and yellow. The lowest concentrations are set to be transparent so that we see the basemap. For these images, we chose to focus on Canada and not show data south of the border. We will continue to run updates to see how air quality fares as we slowly return to some of our normal day-to-day activities.
We thought we would go a step further and see what the BC Air Quality Health Index had to say about this. Would the local ground monitoring stations corroborate the story with the earth observation satellite data? One of our closest monitoring stations is on Topaz street in downtown Victoria, so we plotted the recent months to look for a drop in NO2. In the image below, you’ll see the hourly readings based on a 24-hour moving average in blue. In red, we fitted a smoother trend line to average across a weekly period. We did not get too scientific on this as we are not air quality scientists, but the data does show a drop of about 40%, on average, after isolation directive. I suppose this is also inversely correlated to Dr. Bonnie Henry’s rise in popularity!
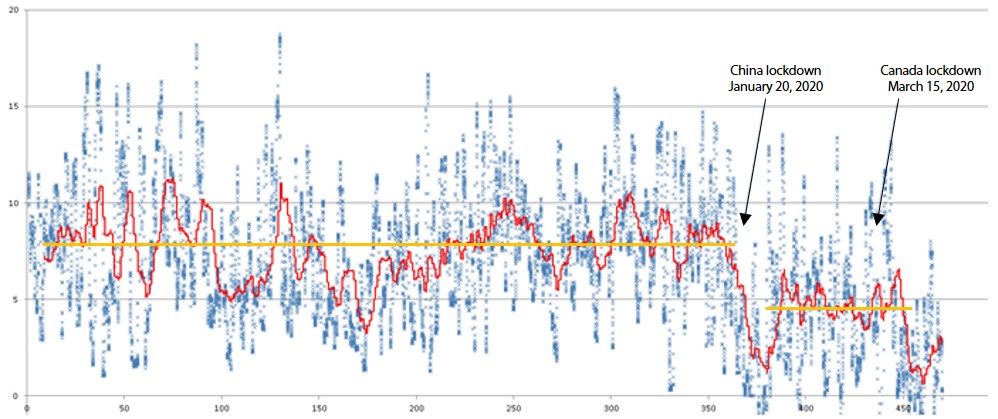
BC Air Quality Health Index data for nitrogen dioxide measured at the Topaz monitoring station in Victoria, BC.
So, what did we learn?
- A little about how nitrogen dioxide concentrations are distributed in Canada
- Something about how our economy and our daily commutes influence air quality
- We also discovered some very interesting satellite datasets that we can leverage for future projects and the processing tools needed to work with multi-temporal datasets over very large areas
In our business we often work with large cumbersome datasets, but more and more we are delving into the world of “big data” and able to complete tasks that previously would have been impossible. Now – we are able to process this in a few spare moments at home between our project workload. I think some of us will also consider riding our bikes more as we begin to ease travel restrictions and get back into the office in the months ahead… maybe we can help prevent the air quality numbers from returning to the status quo.
Written by Justin McPherson and Jas Fajeau