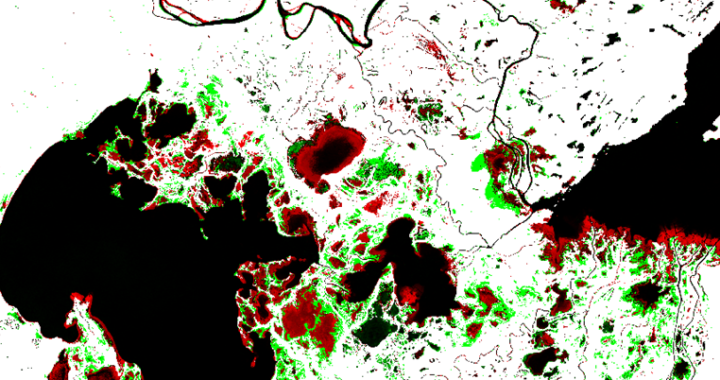
Our remote sensing team at Caslys highlights surface water detection methods in a case study of Northern Alberta and the Peace-Athabasca region. This delta and its dynamic hydrologic environment is a strong example of an area that experiences a high degree of change in surface water levels annually. Check out the article below to see our results and learn more about surface water detection! What is surface water? Surface water refers to any body of water found on the Earth’s surface, encompassing both saltwater and freshwater sources. Freshwater surface bodies such as rivers, streams, and lakes are essential for maintaining ecosystems by providing habitats for diverse plant and animal species. Additionally, they support numerous human activities, including drinking water supply, irrigation, wastewater treatment, livestock management, industrial processes, hydro power generation, and recreational activities. The presence of surface water varies in response to a variety of driving forces including, but not limited to: human activity, environmental change, and climate. Forest fires, floods, rising temperatures, urban and industrial development, as well as other climate factors and human activities all can impact surface water presence. Due to its volatile nature, available hydrologic spatial datasets often overlook seasonal surface water changes. The gap in up-to-date hydrologic data can be filled with raster-based time series approaches that allow us to view hydrology in a more dynamic way. The resulting surface water layers are important for effective planning and decision making in multi-use landscapes. Case Study: The Peace-Athabasca Delta Northern Alberta is home to one of the world’s largest inland freshwater deltas. The area serves as a refuge for more than one million migratory birds each year, as habitat for 270 animal species; including the globe’s largest free-roaming herd of wood bison, as an enclave for native grasses and sedge’s and as the lifeblood for the […]
Continue readingTag Archives: remote sensing
Calgary is Growing – Caslys Monitors Landscape Change
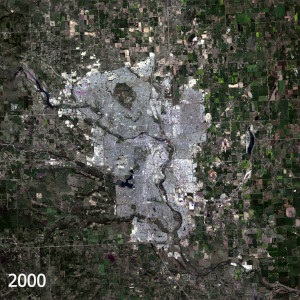
Calgary, Alberta is once again one of the fastest growing cities in Canada. With a constantly evolving city skyline, and growing community boundaries, our team at Caslys thought it would be interesting to apply our landscape change tools to see what’s been happening. We utilized Landsat satellite imagery and our new Caslys Analysis Ready Data (CARD) Stack processes, to explore the change in landscape across Calgary over the past 20+ years. The results are included in the article below, highlighting the overall expansion that the city is experiencing. With a strong job market and diverse amenities, Calgary is an attractive place to be and is recently one of the fastest growing metropolitan areas in Canada. Between 2022 and 2023, Calgary experienced the largest population increase in the country, surpassing 1.6 million people. We applied a few analysis methods to see what the growth distribution looks like on the landscape. There have been some significant growth spurts over the last couple decades. While suburban growth into the agricultural outskirts remains a common theme as you can see in the animation below, there are also new communal green spaces within the city. Development Milestones In 2013, Calgary moved forward with highway construction in two areas, developing the “Ring Road”. It’s part of a larger east-west/north-south trade corridor, and enhances the city’s accessibility. Improved transportation infrastructure helps connect the four quadrants of the city and links the new communities that are developing on the outskirts of Calgary. A projected 17 new neighbourhoods surrounding the city within the 2024 Area Structure Plans and Citywide Growth Strategy were announced. Within the downtown area of Calgary, further transportation development continues to push forward with additional light rail transit lines (LRT) being added to help commuters throughout the city. Olympic Plaza and the Eau Claire Market area […]
Continue reading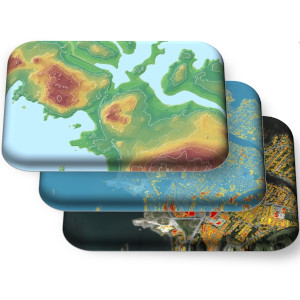
Caslys Releases New Geospatial Service
After years of technical development and internal pilot testing, Caslys Consulting is proud to officially announce our new geospatial service to the remote sensing and GIS world, the Caslys Analysis Ready Data (CARD) Stack! Assembling terrain data, spatial data, or satellite imagery at the beginning of a project is often a complicated and cost inefficient process. There is a large amount of geoprocessing needed to obtain high-quality data, satellite imagery, and build a suite of useful derivative map layers that meet project requirements. This can be a very time-consuming task, using up more project budget than necessary. What is CARD Stack? CARD Stack is a technical resource focused on allowing our customers the ability to easily generate comprehensive spatial datasets. These datasets kick-start both spatial and spectral analyses while also enhancing the visualization of a project site through a simple request submission. Caslys Consulting has created multiple scripts, tools, and geospatial resources with the goal of making this task easier for our customers. CARD Stack services efficiently streamline data package assembly and delivery for a client in a timely manner. Based on the request, a wide range of raster and vector products are consolidated by our team into a single, user-friendly data package. These packages can include: Learn more about CARD Stack today! The Caslys CARD Stack team is excited to help our customers accomplish their geospatial tasks in a fast and efficient manner. For pricing inquiries, product details, and more info on how CARD Stack can help fulfill your project needs, click here or follow the link below. CARD Stack website: https://www.caslys.ca/cardstack/ About Caslys For over 20 years, Caslys Consulting Ltd. has taken pride in offering a wide range of high-quality geospatial services for both environmental and natural resource management industries. Our focus is on interpreting and analyzing data […]
Continue reading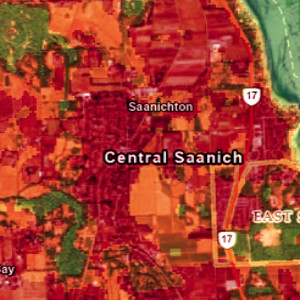
Analyzing Summer Heat Domes using Land Surface Temperature
With summer approaching and anticipation for rising temperatures growing, our team at Caslys reflected on some of the past heat waves in recent memory and dove into some current extreme temperatures being experienced elsewhere in the world. Analysis Completed using CARD Stack Services June of 2021 stood out to many of us in the Victoria region, with record breaking high temperatures causing city wide stress and even pushing businesses to close due to both health and technical issues. Leveraging our CARD Stack services, the Caslys team accessed analysis-ready datasets to further investigate the 2021 heat dome experienced across southern Vancouver Island. Our approach focused on Land Surface Temperatures (LST) as a key parameter. LST differs from classic weather report temperatures, also know as atmospheric (air) temperatures. It is a measurement of ground or surface temperature to the touch, and is an effective weather index that shows variability for studies at regional and global scales. While weather stations and local sensors can provide temperature data, remotely sensed imagery data has proven to be a great source of accurate temperature distributions at high spatial and/or temporal resolutions¹. After acquiring 10 years of Landsat 8 imagery over multiple June dates for the CRD, the LST was calculated and used in this case study to create strong visual indicators of surface temperature extremes. The June 21st, 2021 image showcases the abnormally high surface temperatures experienced across the Saanich Peninsula, reaching upwards of 40oC. This is more than double the expected June temperature high, which between 2000 and 2024, is about 17oC according to historical data. Areas with forest and tall vegetation were much cooler relative to developed areas with concrete or pavement, causing extreme urban heat island effects. Heat Waves Around the World Parts of Mexico and India recently experienced similar abnormal heat waves […]
Continue reading
COVID-19 Isolation and Air Quality in Canada
There was a fair bit of press given to the impact that COVID-19 isolation or lockdown had on air quality in China and northern Italy – two places hard hit by this pandemic and also two places with particularly poor air quality due to industry, transportation and to some extent geography. As our Caslys team began working remotely from home, we wondered how air quality was being impacted here in Canada. So, we leveraged our earth observation skills and tools that we typically use to monitor the Earth’s surface and ventured into the atmosphere. We downloaded data from the Sentinel-5P Troposheric Monitoring Instrument to replicate what we saw in the news overseas. The focus was on nitrogen dioxide (NO2) that comes in large part from the combustion in our cars or the burning of fossil fuels for energy or industry. The Sentinel-5P satellite is able to map a variety of other parameters (listed in the website screen capture above), which may have applications for all sorts of air quality monitoring, but we focused solely on nitrogen dioxide to satisfy our curiosity. To avoid some of the seasonal variation, we plotted the average NO2 concentrations for the period when our local isolation began and the same seasonal range from one year earlier (March 2019 compared to March 2020). We also checked May 2020 to see if the lockdown is still influencing air quality. We looked into a couple of hotspots near Prince Albert, Saskatchewan and found that forest fires were the cause of lower air quality. We plotted the results over the National Geographic basemap service to see the hotspots and the generally improved air quality during isolation. In the images above, the highest concentrations of NO2 in the atmosphere are shown in purple – fading to orange and yellow. The […]
Continue reading